


1898 Rand McNally US Population Density Map -- Rand
Rand Mcnally & Co Sale History
View Price Results for Rand Mcnally & Co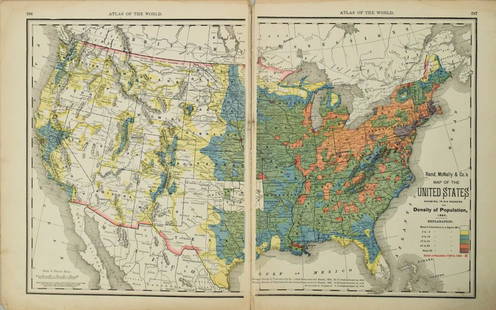


![1895 Rand McNally Map of New Orleans [verso] Louisiana -- Louisiana [verso] New Orleans: Title: 1895 Rand McNally Map of New Orleans [verso] Louisiana -- Louisiana [verso] New Orleans Cartographer: Rand McNally Year / Place: 1895, Chicago Map Dimension (in.): 12.4 X 9.4 in. This is a high](https://p1.liveauctioneers.com/5584/283091/149355547_1_x.jpg?height=310&quality=70&version=1680038985)
Related Maps & Atlases


![1898 Rand McNally Map of Texas [verso] Indian Territory and Oklahoma -- Texas [verso] Oklahoma and: Title: 1898 Rand McNally Map of Texas [verso] Indian Territory and Oklahoma -- Texas [verso] Oklahoma and Indian Territory Cartographer: Rand McNally Year / Place: 1898, Chicago Map Dimension (in.): 9](https://p1.liveauctioneers.com/5584/328338/176911581_1_x.jpg?height=310&quality=70&version=1715113718)
![1914 Rand McNally Map of Austria-Hungary [verso] German Empire -- Austria-Hungary [verso] German: Title: 1914 Rand McNally Map of Austria-Hungary [verso] German Empire -- Austria-Hungary [verso] German Empire Cartographer: Rand McNally Year / Place: 1914, Chicago Map Dimension (in.): 9.2 X 13 in.](https://p1.liveauctioneers.com/5584/328338/176911532_1_x.jpg?height=310&quality=70&version=1715113718)
![1888 Rand McNally Map of Louisiana -- [Louisiana]: Title: 1888 Rand McNally Map of Louisiana -- [Louisiana] Cartographer: Rand McNally Year / Place: 1888, Chicaho Map Dimension (in.): 12.7 X 19.1 in. This is an excellent, large map of Louisiana. Plent](https://p1.liveauctioneers.com/5584/328338/176911517_1_x.jpg?height=310&quality=70&version=1715113718)

More Items in Maps & Atlases
View More

![[Maps] Martin Zeiler, Itinerarium Italiae, 1640: [Maps] Martin Zeiler, Itinerarium Italiae, 1640, Martini Zeilleri. Itinerarium Italiae Nov-Antiquae: oder, Raiss-Beschreibung durch Italien, Matthaus Merian, Frankfurt, 40 plates, most double-page, in](https://p1.liveauctioneers.com/188/326797/176317459_1_x.jpg?height=310&quality=70&version=1713847031)
![[Maps] Gio. Ant. Magnini, Italia, 1620: [Maps] Gio. Ant. Magnini, Italia, 1620, Giovanni Antonio Magnini. Italia, data in luce da Fabio suo figliuolo al Serenissimo Ferdinado Gonzaga Duca di Matoua edi Monserrato etc. Bologna, for Sebastian](https://p1.liveauctioneers.com/188/326797/176317457_1_x.jpg?height=310&quality=70&version=1713847031)


Recommended Transportation & Travel Collectibles
View More


Item Details
Description
This is a fascinating map, showing the population density of the US in 1890 from below 2 people per square mile to over 90. The Northeast and parts of the Midwest have the highest densities. The South, and especially the West are shown to be sparsely populatated. Strikingly, the Los Angeles area had 6-18 people per sq. mi. The movement of the Population Center moving westward is shown -- near Baltimore in 1780 and just west of Cincinnati in 1890.
Reserve: $50.00
Shipping:
Your purchase is protected:
Photos, descriptions, and estimates were prepared with the utmost care by a fully certified expert and appraiser. All items in this sale are guaranteed authentic.
In the rare event that the item did not conform to the lot description in the sale, Jasper52 specialists are here to help. Buyers may return the item for a full refund provided you notify Jasper52 within 5 days of receiving the item.
Condition
Very Good. Slight soiling, toning. Colored. On 2 sheets.
Buyer's Premium
- 15%
1898 Rand McNally US Population Density Map -- Rand
Estimate $60 - $70
2 bidders are watching this item.
Get approved to bid.
Shipping & Pickup Options
Item located in Ohio, US$15 shipping in the US
Payment
See More Items From This Jasper52 Seller

Auction Curated By

Maps Expert
TOP